sdg:
sdg:
-
3
-
8
-
13
-
16
Investments
Our investments (ex-M&A) reached BRL 2,862.2 million in 2023, moving 8.2% up compared to the previous year, mainly due to expenditures with expansion projects.
Investments in the maintenance of our operations totaled BRL 313.9 million, which is equivalent to 1.2% of net revenue from hospitals, oncology and other lines recorded in the period (2.1% in the previous year).
| (BRL million) | 2023 | 2022 | Change (%) |
|---|---|---|---|
| Capex | 2,862.2 | 2,645.3 | 8.2 |
| Maintenance | 313.9 | 472.8 | -33.6 |
| Expansion | 2,548.4 | 2,172.5 | 17.3 |
| Mergers & Acquisitions | 45.7 | 1,033.3 | -95.6 |
| Total investment | 2,908.0 | 3,678.6 | -20.9 |
Over the last 20 years, our growth strategy has been characterized by high volume of acquisitions, accompanied by successful integration processes. Since filing for the IPO, in October/2020, we have already announced 17 acquisitions, which added 2,213 new beds to our service network.
The returns from Rede D’Or’s integration strategy come from economies of scale and the effects of synergies
in optimizing operational costs, in addition to potential revenue gains from an increase in the volume of services and the complexity of procedures performed in the units. These are coupled with benefits of improving
the units’ technology park, the relationship with the medical profession, and the level of quality and variety of services provided in each unit [GRI 3-3]
Further information on the projects under development can be found in our Reference Form, available on our website https://ri.rededorsaoluiz.com.br.
Organic growth
The business strategy we adopt at Rede D’Or includes taking parallel and complementary initiatives that promote our organic growth through greenfield (new units) and brownfield (expansions of existing units) projects to expand our operational capacity. In May 2023, we updated our Reference Form, which currently contains 63 projects that together add 6,634 new beds.
In addition to the start of operations at Hospital São Luiz Campinas (SP), four major projects are in the final stages of execution by the end of 2023: Memorial Star, Aliança Complex, Macaé, and Vila Nova Star II (Itaim Torre).
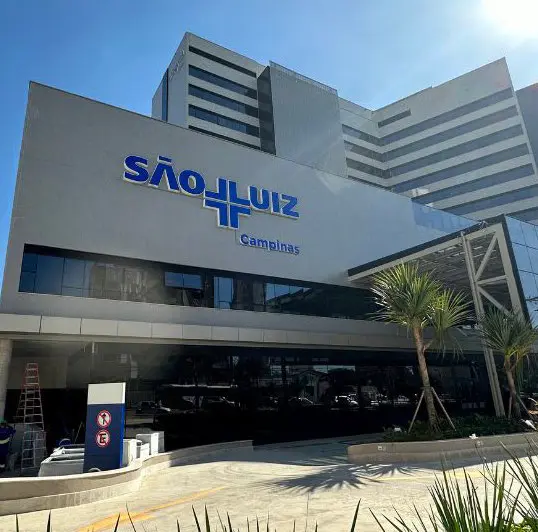
Projects delivered in the last three fiscal years and those already planned for the coming years
| Project | Type | Beds | Completion | Investments | State |
|---|---|---|---|---|---|
| Total (with set dates) | 6,634 | 9,867,944 | |||
| Greenfield projects (GF) | 2,083 | 3,368,757 | |||
| 1 Itaim R. Helena (Delivered) | GF | 173 | 2021 | 217,974 | São Paulo |
| 2 Campinas (Delivered) | GF | 325 | 2022 | 441,308 | São Paulo |
| 3 Memorial Star - Phase 1 | GF | 150 | 2023 | 405,462 | Pernambuco |
| 4 Macaé - Phase 1 | GF | 150 | 2023 | 226,033 | Rio de Janeiro |
| 5 Alphaville - Phase 1 | GF | 212 | 2024 | 392,908 | São Paulo |
| 6 Guarulhos - Phase 1 | GF | 268 | 2024 | 446,562 | São Paulo |
| 7 Novo Barra | 253 | 2024 | 513,485 | Rio de Janeiro | |
| 8 Taubaté - Phase 1 | 120 | 2025 | 119,101 | São Paulo | |
| 9 Novo Aviccena | 150 | 2025 | 183,782 | São Paulo | |
| 10 São Conrado | 132 | 2026 | 265,297 | Rio de Janeiro | |
| 11 Santos | 150 | 2027 | 156,845 | São Paulo | |
| Brownfields ("BF") | 4,551 | 6,499,188 | |||
| 1 CEMA - Fase 1 (Delivered) | BF | 14 | 2021 | 10,267 | São Paulo |
| 2 São Vicente - Fase 1 (Delivered) | BF | 35 | 2021 | 61,735 | Rio de Janeiro |
| 3 São Rafael - Fase 1 (Delivered) | BF | 50 | 2021 | 34,989 | Bahia |
| 4 Sino Torre (Delivered) | BF | 90 | 2021 | 184,932 | São Paulo |
| 5 Expansões Diversas (Delivered) | BF | 49 | 2021 | 19,600 | N/D |
| 6 Cardio Pulmonar (Delivered) | BF | 32 | 2022 | 26,789 | Bahia |
| 7 CEMA - Fase 2 (Delivered) | BF | 65 | 2022 | 26,579 | São Paulo |
| 8 Mauá - Fase 1 (Delivered) | BF | 11 | 2022 | 8,505 | São Paulo |
| 9 São Vicente - Fase 2 (Delivered) | BF | 35 | 2022 | 60,103 | Rio de Janeiro |
| 10 Ribeirão Pires - Fase 1 (Delivered) | BF | 16 | 2022 | 6,167 | São Paulo |
| 11 São Rafael - Fase 2 (Delivered) | BF | 62 | 2022 | 40,598 | Bahia |
| 12 Various Expansions 2022 (Delivered) | BF | 14 | 2022 | 4,787 | N/D |
| 13 Itaim Tower | BF | 140 | 2023 | 347,784 | São Paulo |
| 14 Aliança | BF | 196 | 2023 | 282,390 | Bahia |
| 15 Serra Mayor - Phase 1 | BF | 25 | 2023 | 12,199 | São Paulo |
| 16 Atibaia - Phase 1 | BF | 24 | 2023 | 16,103 | São Paulo |
| 17 Santa Isabel - Phase 1 | BF | 10 | 2023 | 10,008 | São Paulo |
| 18 Central Leste - Phase 1 | BF | 10 | 2023 | 8,008 | São Paulo |
| 19 Various Expansions 2023 | BF | 298 | 2023 | 461,900 | N/D |
| 20 Ribeirão Pires - Phase 2 | BF | 27 | 2024 | 38,176 | São Paulo |
| 21 Assunção Torre - Phase 1 | BF | 183 | 2024 | 299,646 | São Paulo |
| 22 Serra Mayor - Phase 2 | BF | 19 | 2024 | 20,157 | São Paulo |
| 23 Santa Isabel - Phase 2 | BF | 26 | 2024 | 27,583 | São Paulo |
| 24 Oeste | BF | 100 | 2024 | 112,080 | Rio de Janeiro |
| 25 Santa Cruz - Phase 1 | BF | 50 | 2024 | 98,113 | Paraná |
| 26 Aeroporto - Phase 1 | BF | 34 | 2024 | 35,700 | Bahia |
| 27 Various Expansions 2024 | BF | 320 | 2024 | 35,700 | N/D |
| 28 São Lucas | BF | 115 | 2025 | 236,009 | Sergipe |
| 29 Brasil Bloco C | BF | 330 | 2025 | 561,543 | São Paulo |
| 30 Atibaia - Phase 2 | BF | 98 | 2025 | 112,357 | São Paulo |
| 31 Santa Isabel - Phase 3 | BF | 25 | 2025 | 26,523 | São Paulo |
| 32 UDI Tower Phase 1 | BF | 130 | 2025 | 265,954 | Maranhão |
| 33 São Carlos | BF | 60 | 2025 | 63,946 | Ceará |
| 34 Nova Torre Caxias | BF | 92 | 2025 | 125,172 | Rio de Janeiro |
| 35 DF Star-Phase 1 | BF | 80 | 2025 | 156,518 | Distrito Federal |
| 36 Vivalle | BF | 40 | 2025 | 47,698 | São Paulo |
| 37 Central Leste - Phase 2 | BF | 77 | 2025 | 87,819 | São Paulo |
| 38 Ribeirão Pires - Phase 3 | BF | 82 | 2026 | 84,575 | São Paulo |
| 39 Mauá - Phase 2 | BF | 219 | 2026 | 277,536 | São Paulo |
| 40 Proncor | BF | 84 | 2026 | 102,568 | Mato Grosso do Sul |
| 41 Artur Ramos | BF | 64 | 2026 | 78,147 | Maceió |
| 42 BH Star | BF | 150 | 2026 | 306,038 | Minas Gerais |
| 43 Assunção Tower - Phase 2 | BF | 54 | 2027 | 62,848 | São Paulo |
| 44 DF Star - Phase 2 | BF | 83 | 2027 | 162,387 | Distrito Federal |
| 45 Lot 4 Project | BF | 150 | 2027 | 174,578 | Distrito Federal |
| 46 Nossa Senhora das Neves | BF | 74 | 2027 | 90,358 | Paraíba |
| 47 Circular do Bosque | BF | 81 | 2027 | 94,272 | São Paulo |
| 48 Esperança | BF | 64 | 2027 | 74,486 | Pernambuco |
| 49 Santa Cruz - Phase 2 | BF | 50 | 2027 | 98,113 | Paraná |
| 50 Aeroporto - Phase 2 | BF | 115 | 2027 | 133,843 | Bahia |
| 51 São Luiz Jabaquara | BF | 69 | 2027 | 80,306 | São Paulo |
| 52 Quinta - Phase 1 | BF | 200 | 2027 | 244,700 | Rio de Janeiro |
Investment in infrastructure
In our infrastructure projects, we maintain strict parameters that show our concern in implementing ESG aspects that are very significant for the society [GRI 3-3].


